Dashboards & cross-project views
High level & cross-project views of what’s going on across all initiatives.
- No credit card required
- ISO 27001 certified
- Made & hosted in the EU
Trusted by








Detailed reports in a few clicks
Mix charts, key figures, card lists and live views in a flexible grid, for one workspace or across all of them.
Compose your dashboard like a page
Position and resize the widgets freely on a grid. Next to the charts and the metrics, embed the documents, whiteboards and web pages that give your numbers their context.
- Charts and metrics on the data of any field
- Card lists displayed in the view mode of your choice
- Documents, whiteboards and web pages embedded as widgets
- Custom queries written with the KQL language
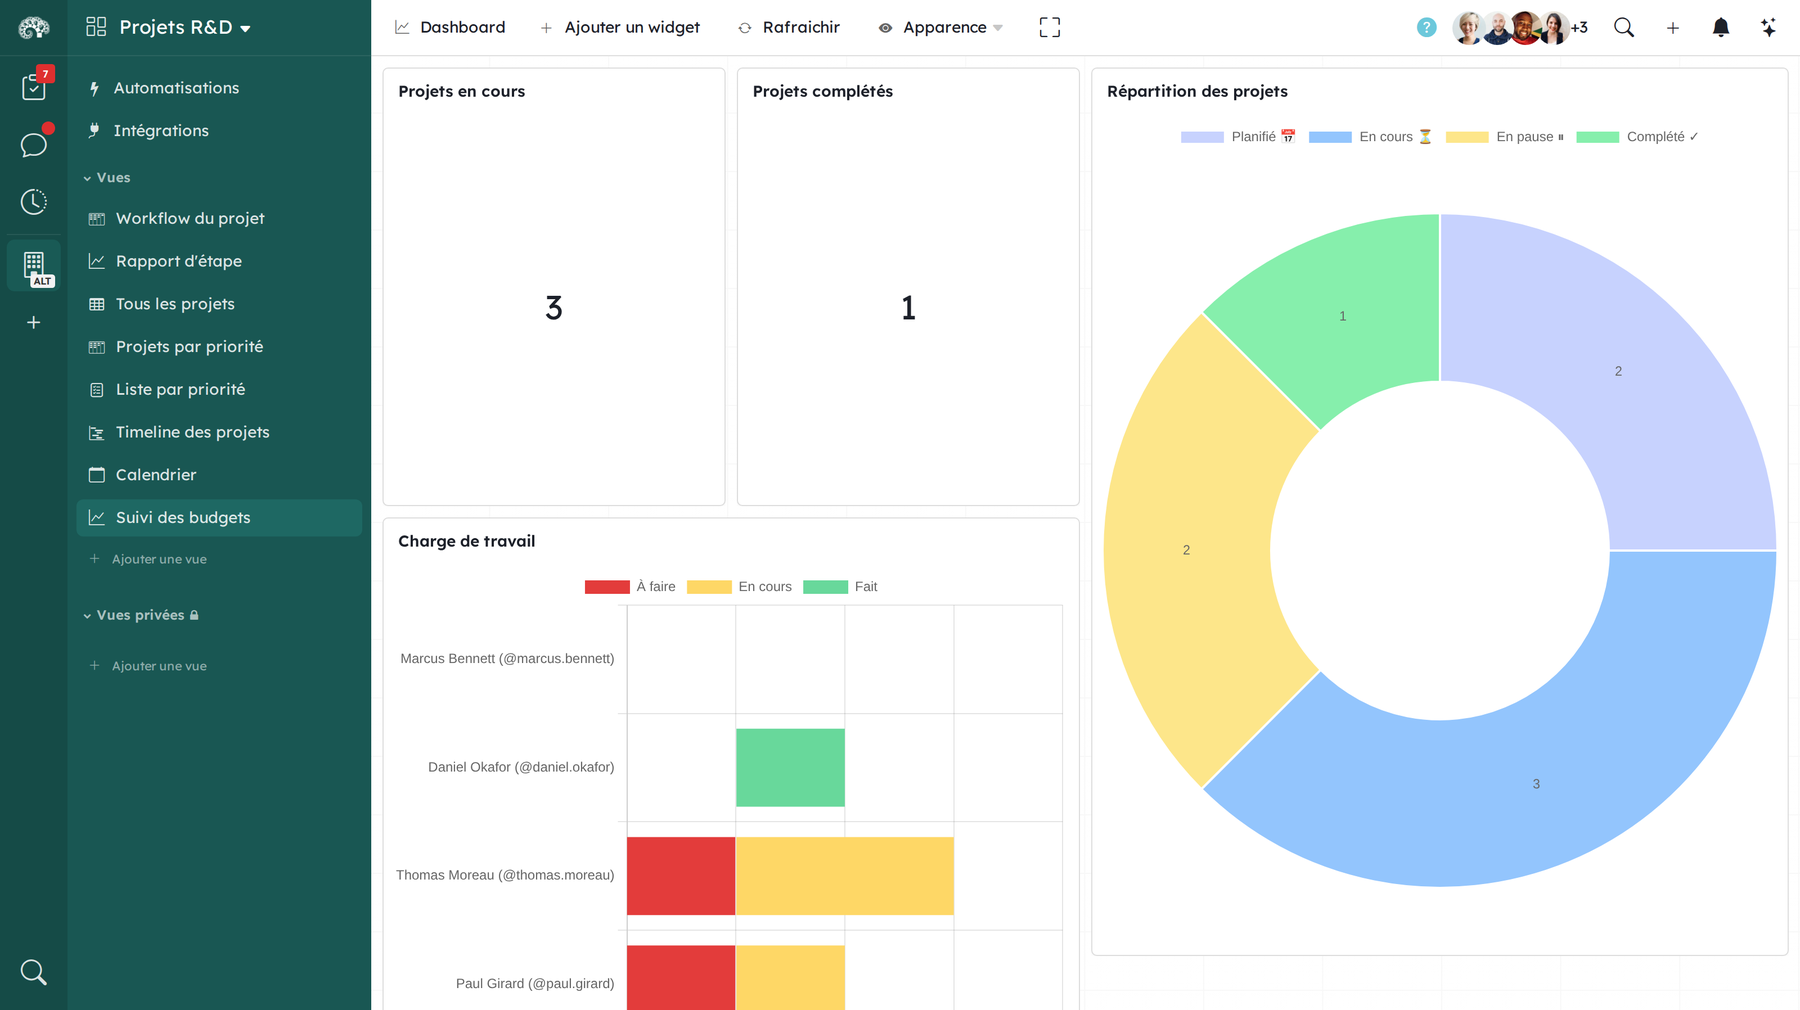
Get insights on your projects
Customized dashboards are just a click away with our easy-to-use editor. Combine figures with many charts to get a better understanding of your work.
- Create custom dashboards and cross-projects views
- Visualize relevant information
- Keep track of your progress
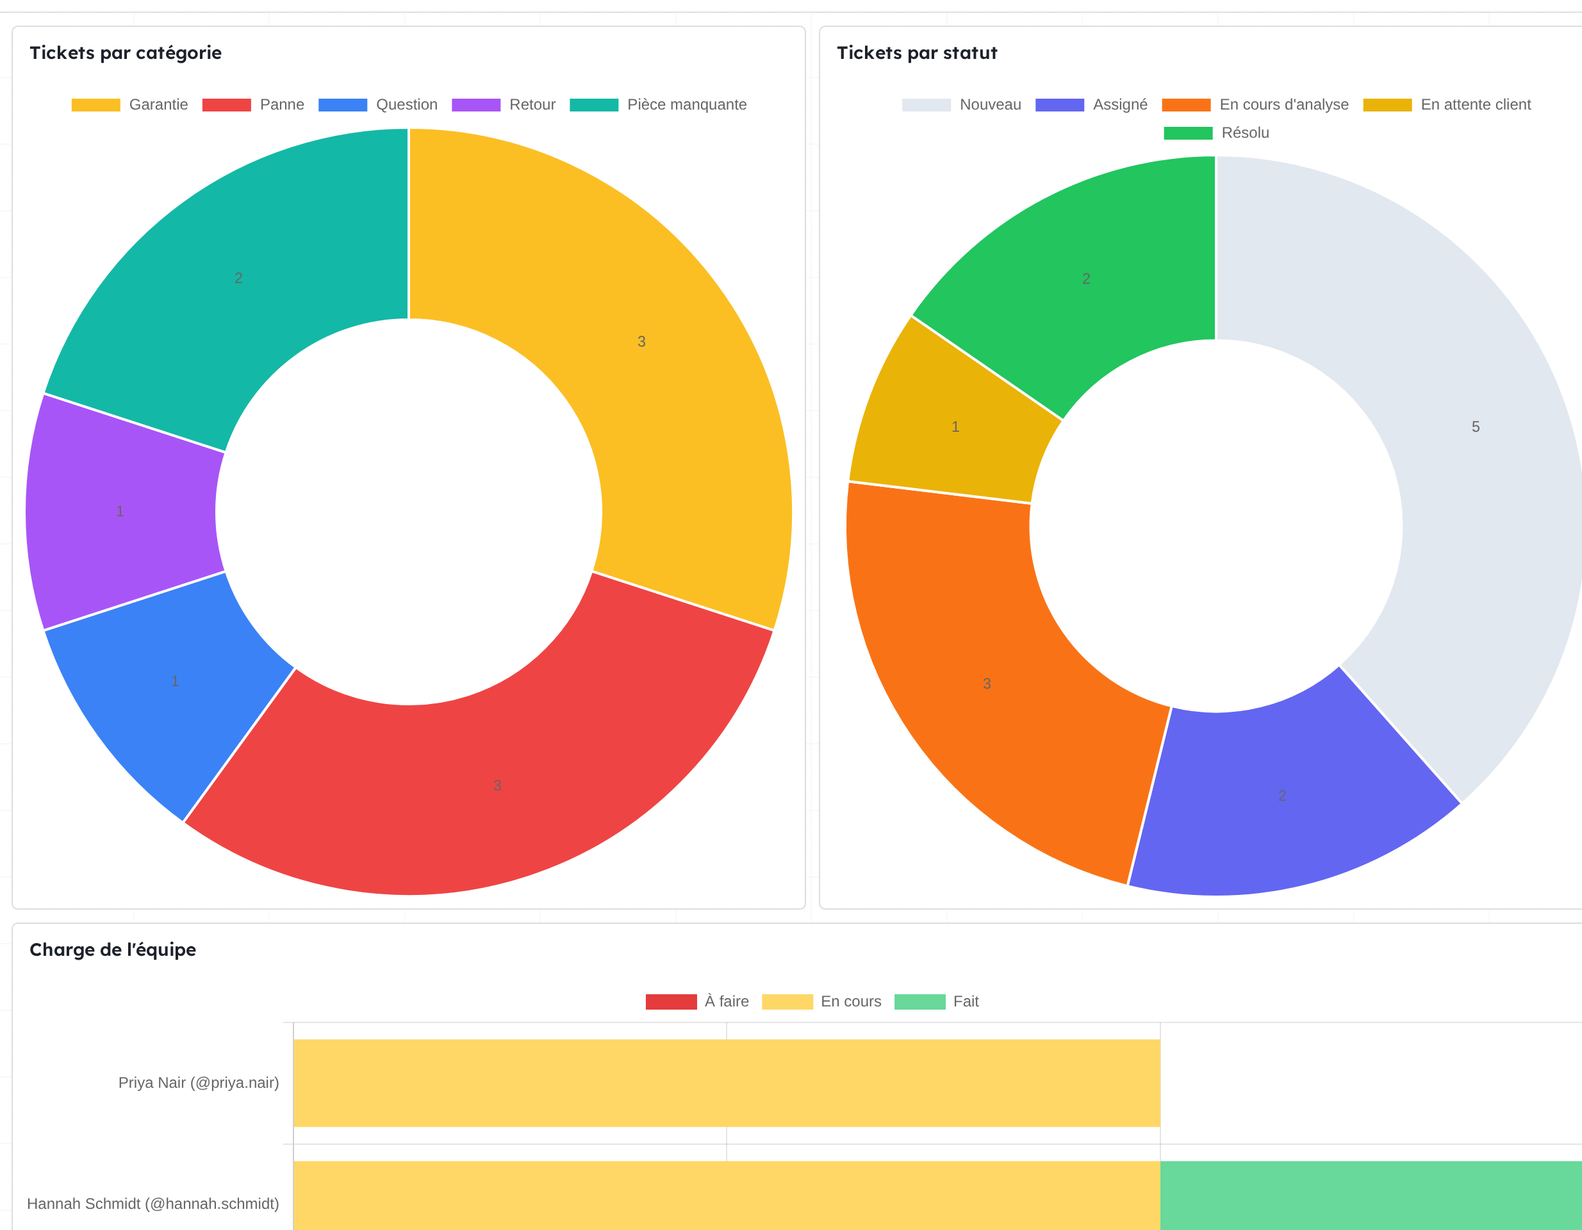
Pilot your activity
Represent your activity with accuracy thanks to meaningful dashboards allowing you to pilot your projects on a daily basis.
- Define specific views
- See what's going on across all your projects
- Identify bottlenecks in your processes
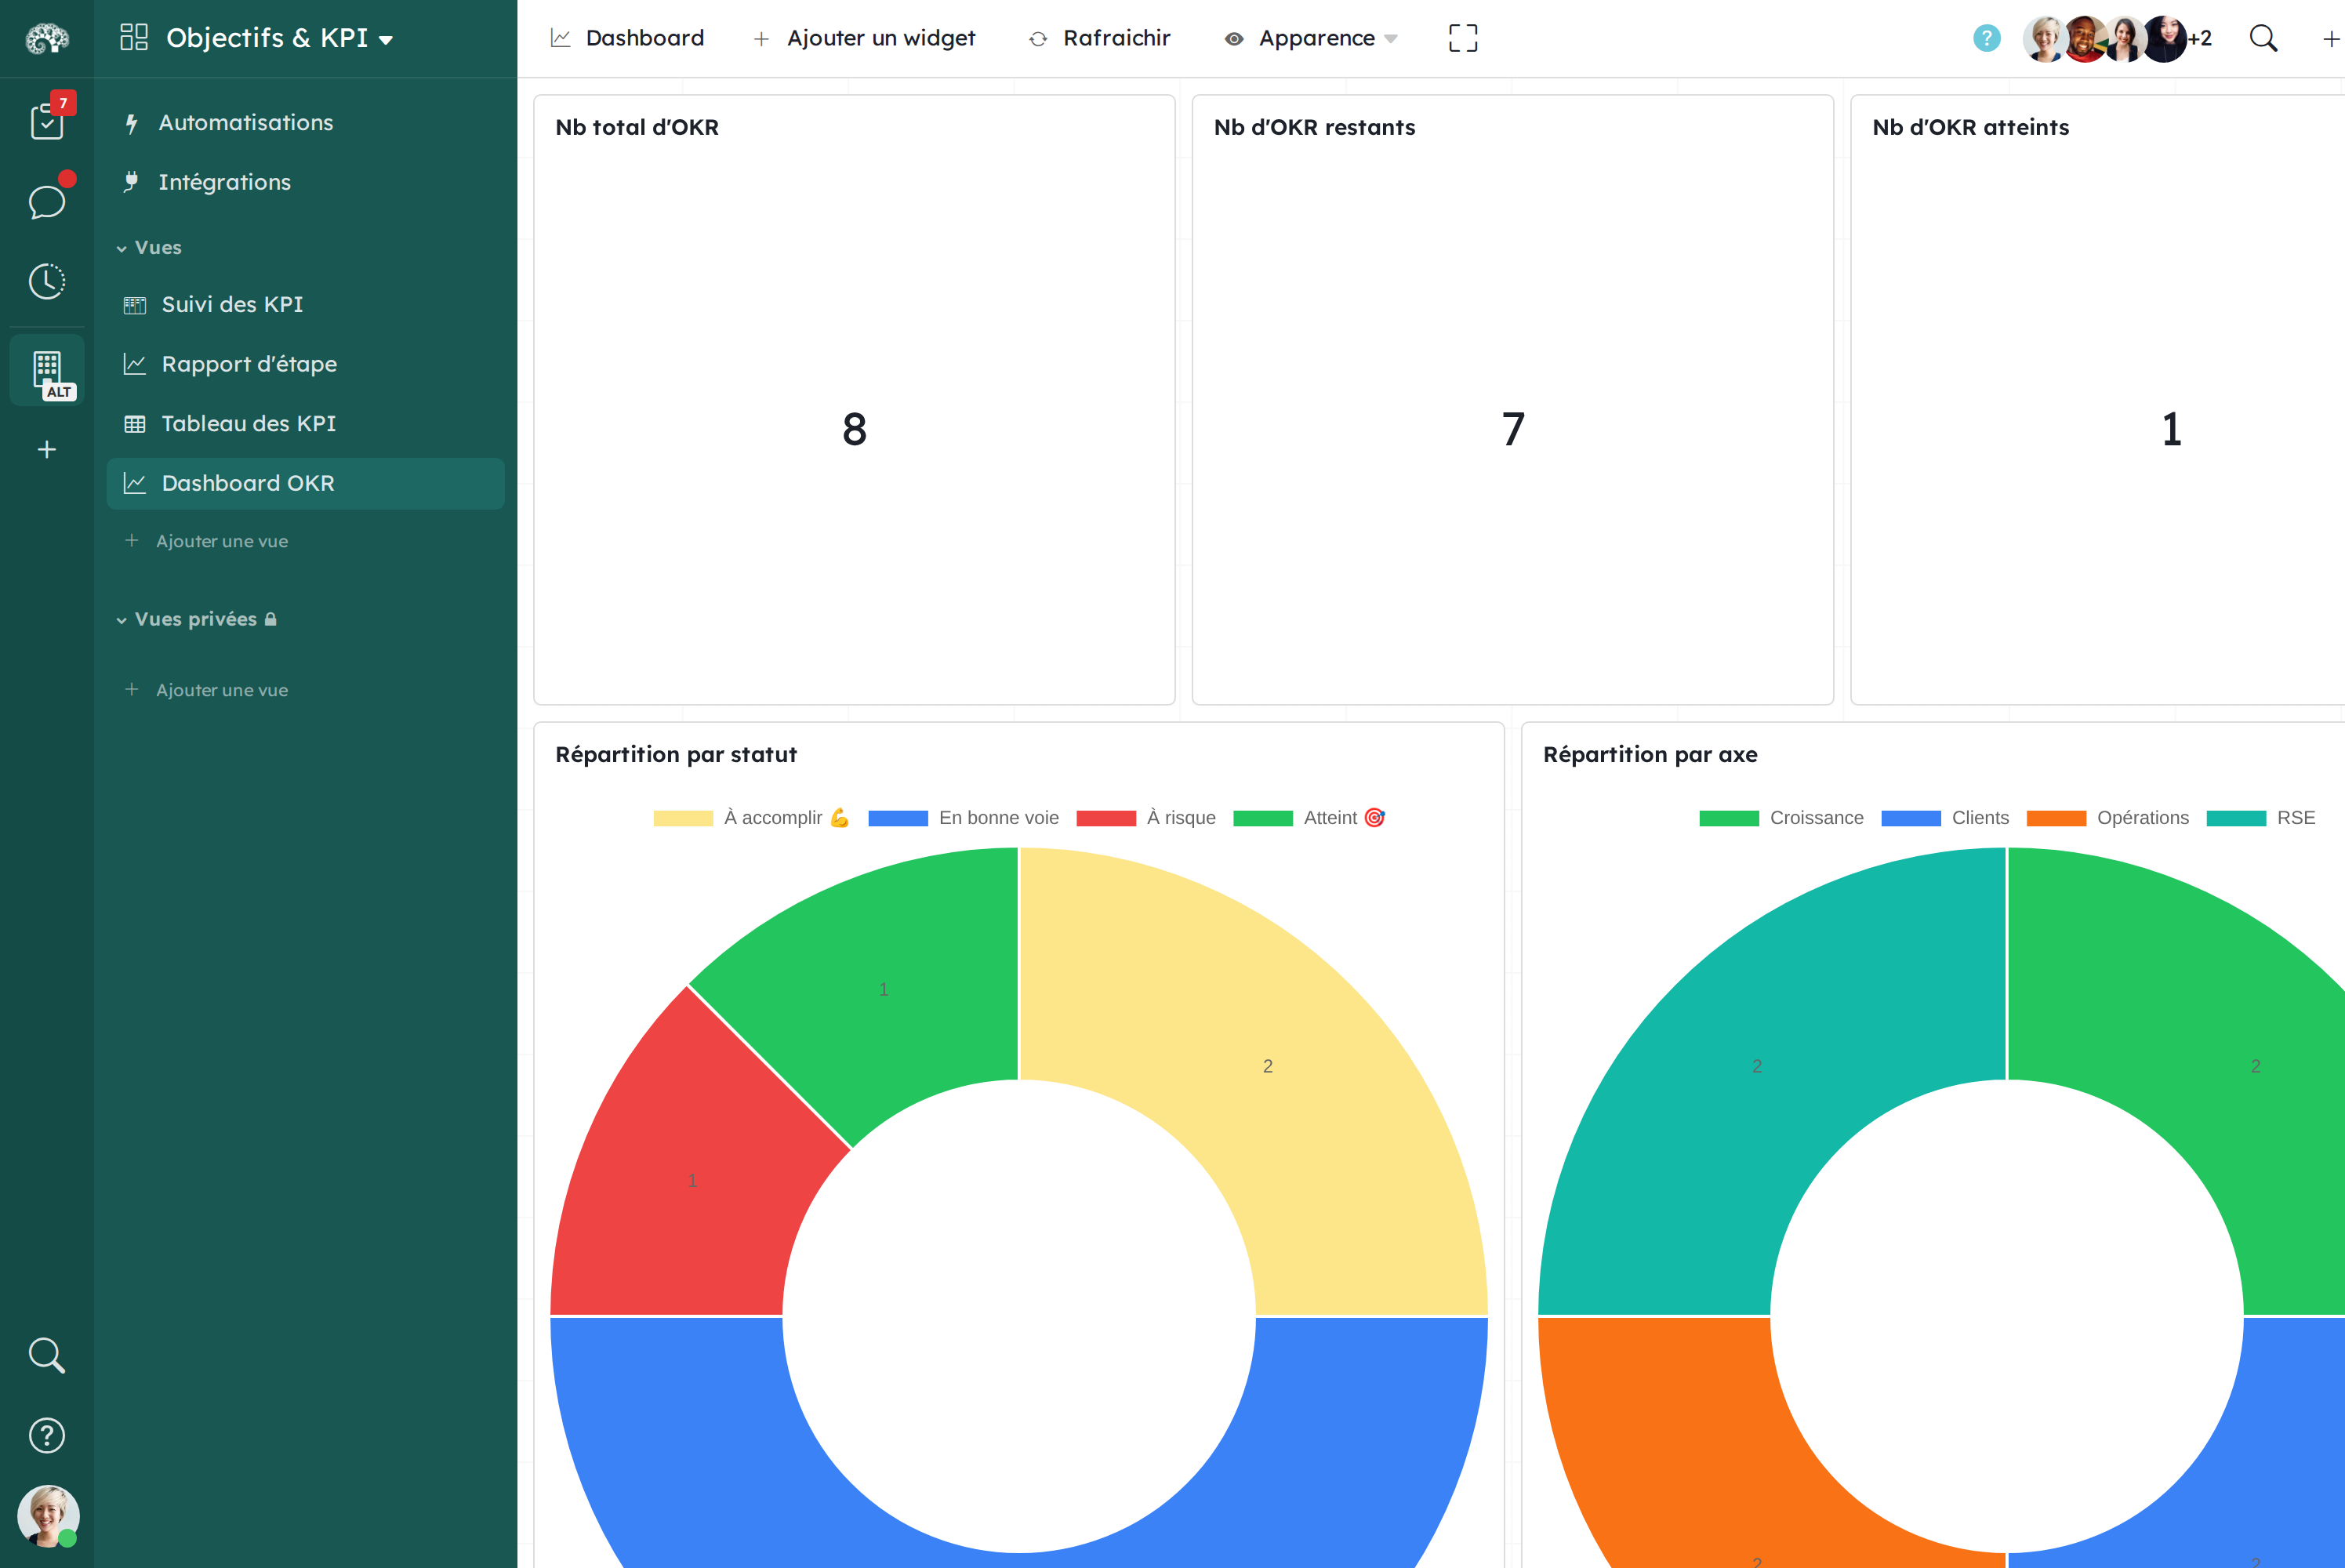
Cross-project dashboards for the big picture
A dashboard does not have to stop at the borders of a workspace. Global dashboards and global views gather the cards of all your projects on a single screen, to compare them and spot what needs your attention.
- Bring together the cards of several workspaces
- Follow every project, team and deadline from one place
- Search and filter across your whole organization
Execute in confidence
Facilitate data-driven decisions for your team by providing meaningful insights.
- Work together creating and sharing analytics
- Improve your workflows based on data, facts and feedback
- Gain in productivity
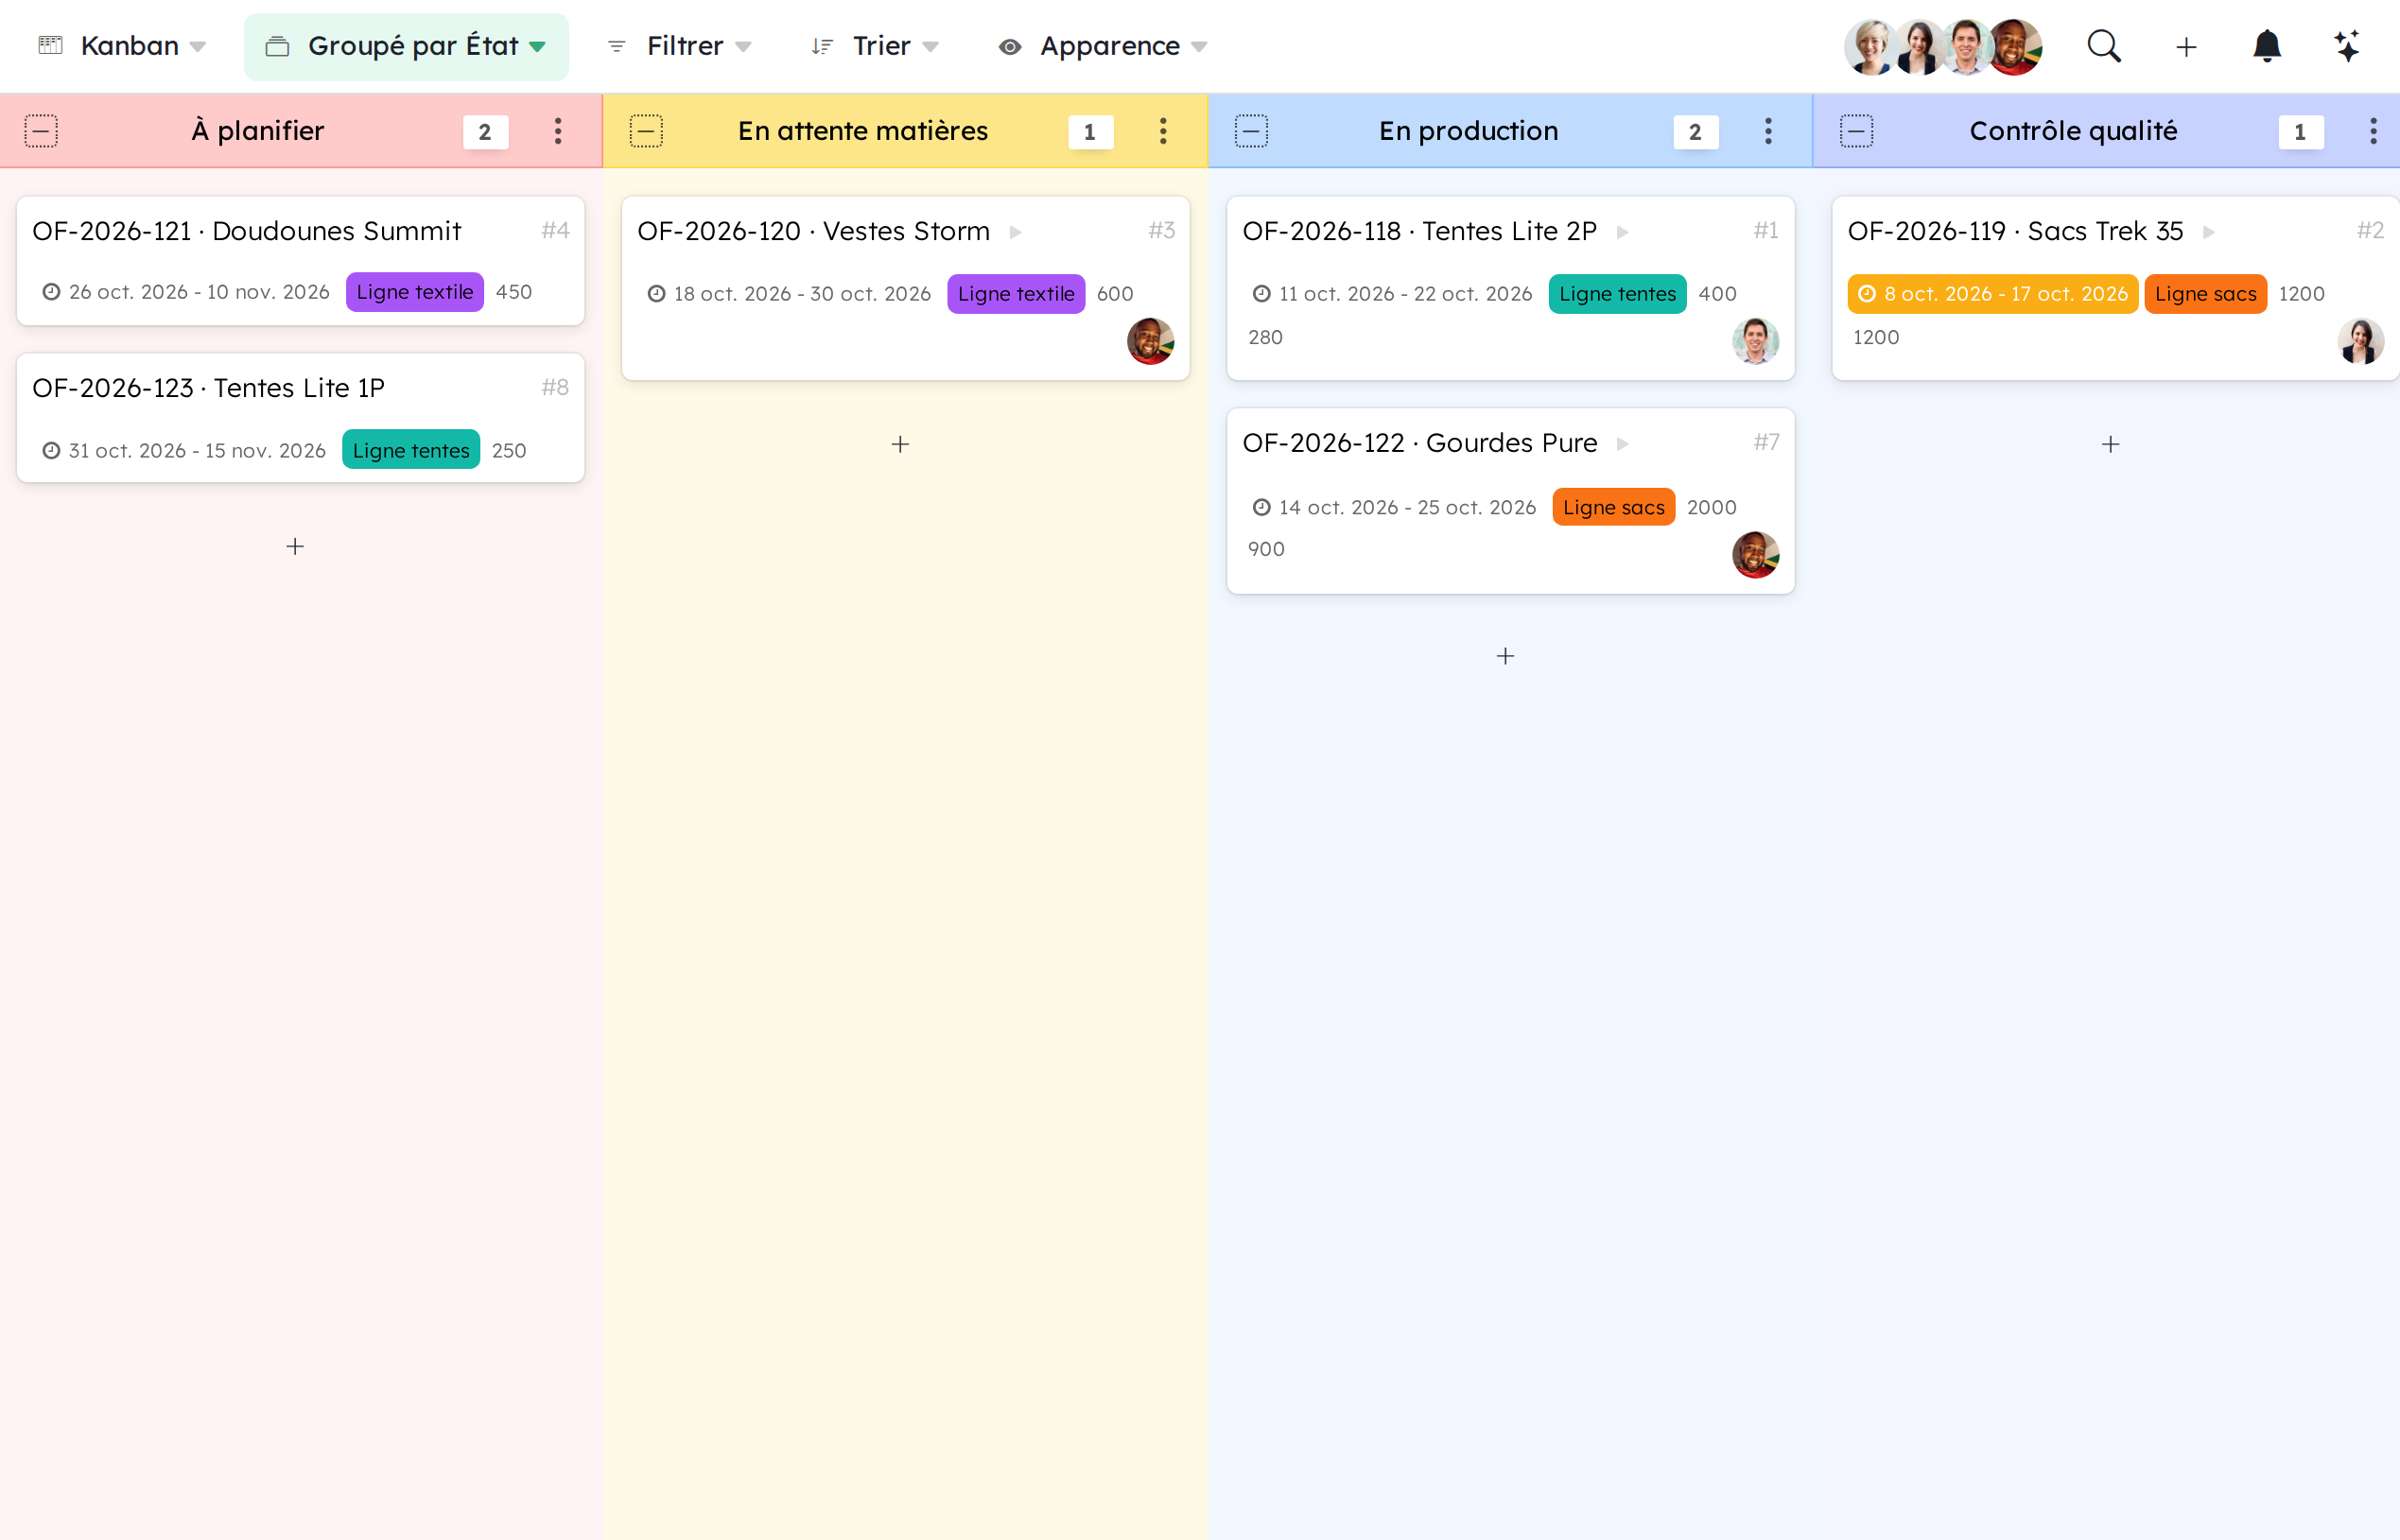
Available from everywhere
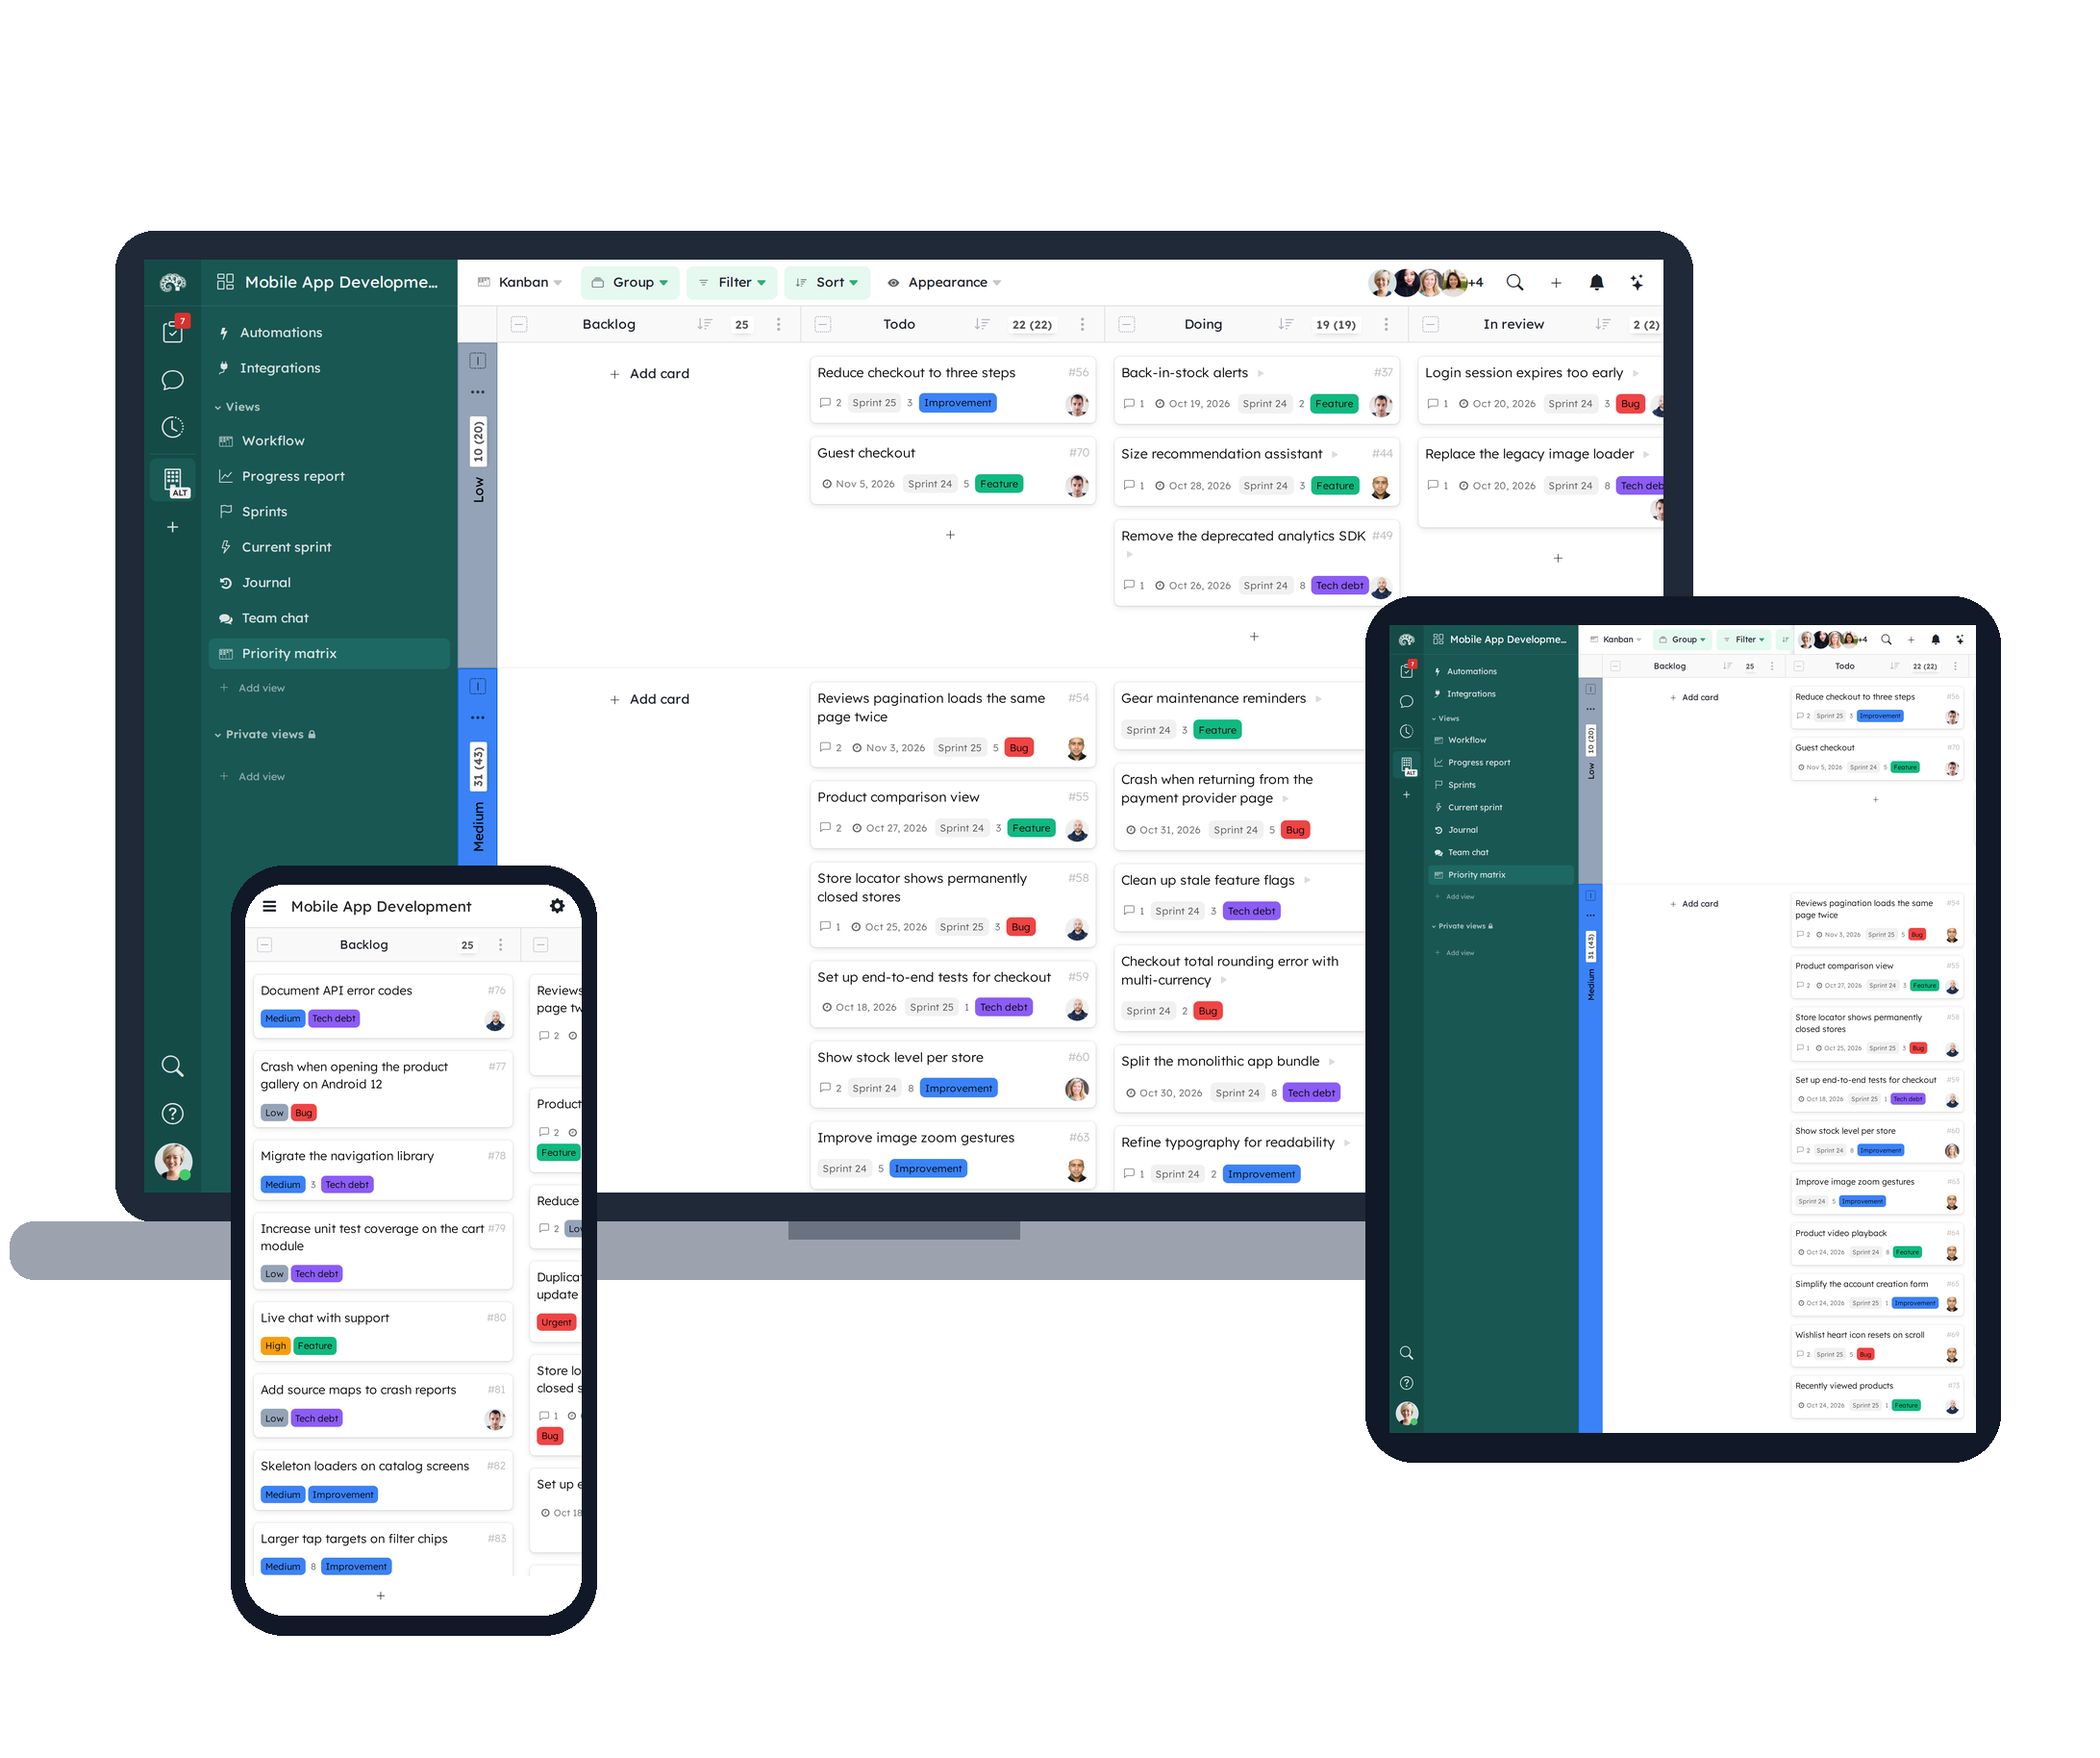
Kantree is made for hybrid teams and remote work
- iOS and Android apps
- Offline support
There's definitely a template for you
Start in a few clicks with our templates
Ready to give it a try?
Start your free trial in a few minutes, or let us show you how Kantree fits the way your team works.
- 15-day free trial
- No credit card required